No products in the cart.
Power BI for Pharma: How Data Analytics is Transforming Pharmaceutical Manufacturing Operations
Introduction
The pharmaceutical industry is undergoing a massive transformation. As manufacturing facilities become increasingly automated and regulatory requirements continue to grow, organizations are generating enormous volumes of data every day. The challenge is no longer collecting data—it is turning that data into meaningful business insights.
This is where Power BI for Pharma is creating a significant impact.
From production monitoring and quality assurance to maintenance management and regulatory compliance, pharmaceutical companies are leveraging modern analytics platforms to make smarter decisions faster than ever before. Organizations that effectively utilize pharma data analytics are improving productivity, reducing costs, minimizing deviations, and enhancing regulatory readiness.
In today’s competitive landscape, data-driven decision-making is no longer optional—it is a strategic necessity.
In this article, we’ll explore how Power BI is transforming pharmaceutical manufacturing operations, key use cases, implementation strategies, benefits, and how pharma professionals can build valuable analytics skills to stay ahead in the Industry 4.0 era.
Why Pharmaceutical Manufacturing Needs Data Analytics
Pharmaceutical manufacturing environments generate data from multiple systems including:
- ERP Systems
- Manufacturing Execution Systems (MES)
- SCADA Systems
- Building Management Systems (BMS)
- Environmental Monitoring Systems (EMS)
- Laboratory Information Management Systems (LIMS)
- Quality Management Systems (QMS)
- Maintenance Management Systems
The problem is that this data often exists in silos.
Production teams view one system.
Quality teams use another.
Engineering teams rely on separate reports.
Management receives delayed information through spreadsheets.
This fragmented approach creates:
- Delayed decision-making
- Increased manual reporting effort
- Limited visibility across departments
- Higher risk of compliance issues
- Missed improvement opportunities
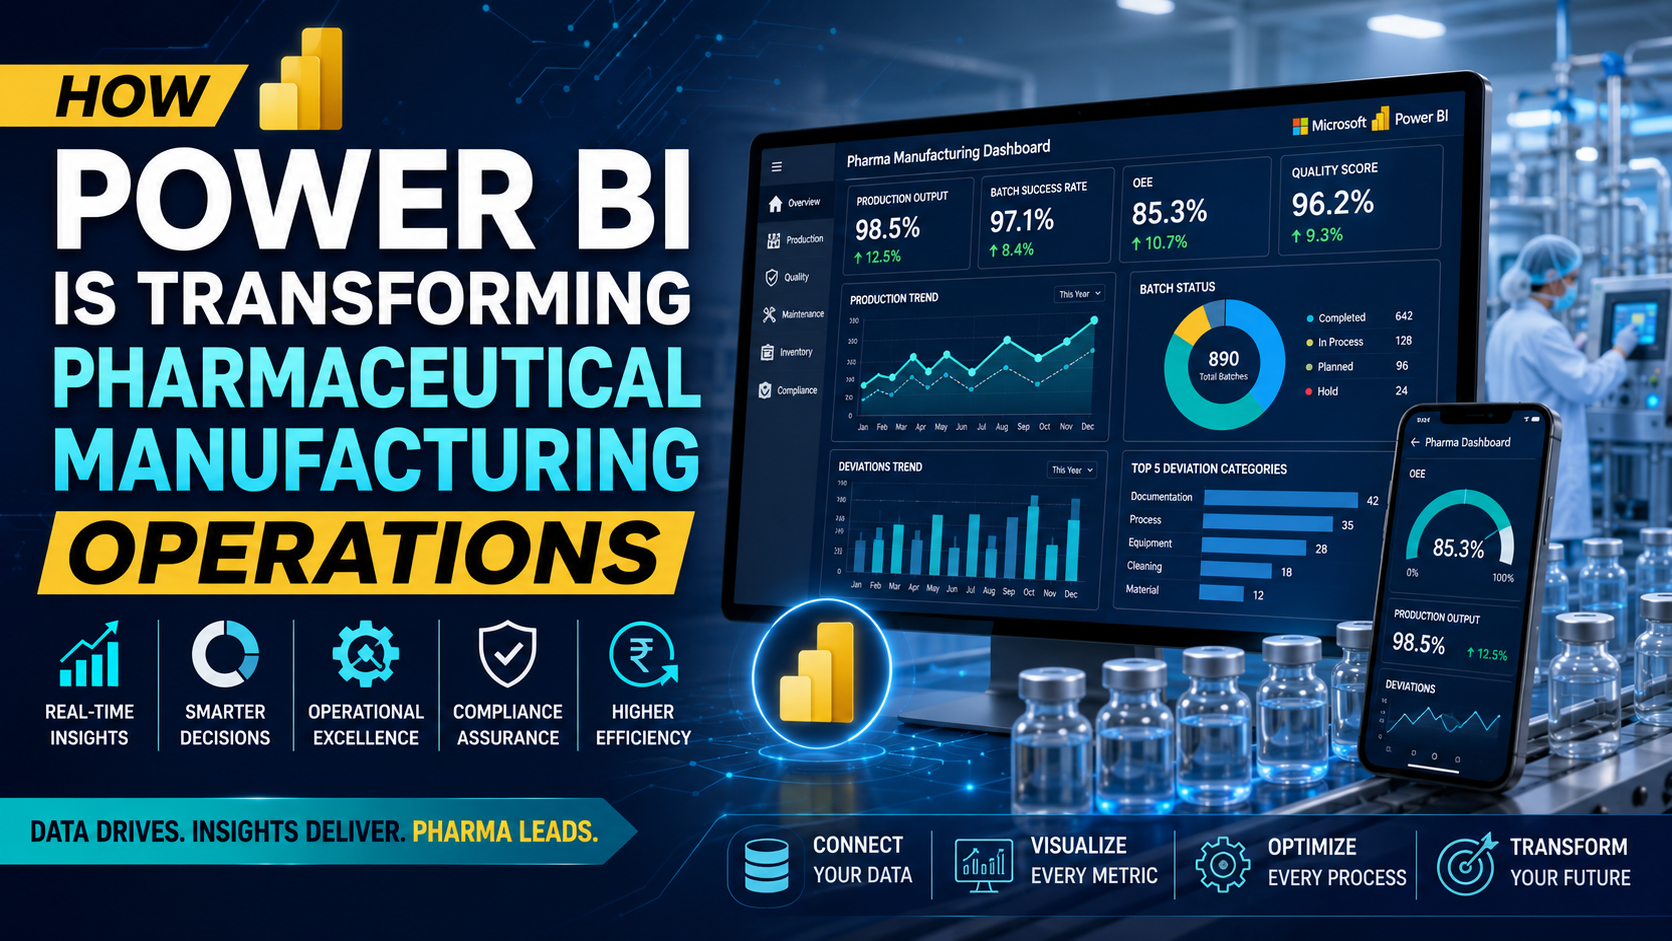
Modern pharma dashboards solve these challenges by consolidating data into a single, real-time view.
What is Power BI?
Microsoft Power BI is a business intelligence and data visualization platform that converts raw data into interactive dashboards and reports.
It allows pharmaceutical companies to:
- Connect multiple data sources
- Automate reporting
- Visualize trends
- Monitor KPIs in real time
- Generate actionable insights
- Improve decision-making
Instead of spending hours preparing Excel reports, teams can access live dashboards that update automatically.
This capability makes Power BI for Pharma one of the most valuable digital transformation tools available today.
How Power BI for Pharma is Transforming Manufacturing Operations
1. Real-Time Production Monitoring
Traditional production reporting often happens at the end of a shift or even the next day.
With Power BI, manufacturing teams can monitor:
- Batch progress
- Equipment status
- Production output
- Downtime events
- Yield performance
- OEE (Overall Equipment Effectiveness)
Example
A sterile injectable manufacturing facility can display:
- Number of batches completed
- Current batch status
- Production efficiency
- Equipment utilization
- Shift-wise performance
Real-time visibility allows supervisors to address issues immediately instead of discovering them after production losses occur.
2. Enhanced Quality Management
Quality is the backbone of pharmaceutical manufacturing.
Power BI enables organizations to track quality metrics through interactive pharma dashboards.
Key metrics include:
- Deviations
- CAPAs
- OOS investigations
- Change controls
- Audit observations
- Batch rejection trends
Example Dashboard
A Quality Head can instantly view:
- Open deviations by department
- Average closure time
- Repeat deviations
- Root cause categories
- Monthly compliance trends
This proactive visibility significantly improves quality culture and compliance performance.
3. Predictive Maintenance and Equipment Reliability
Unexpected equipment failures can result in:
- Production delays
- Batch losses
- Increased maintenance costs
Using pharma data analytics, organizations can monitor:
- Vibration data
- Temperature trends
- Pressure variations
- Equipment runtime
- Failure frequency
Power BI integrates with maintenance systems to provide predictive maintenance dashboards.
Benefits
- Reduced downtime
- Increased equipment life
- Lower maintenance costs
- Better planning
This is one of the most practical Industry 4.0 applications currently being adopted in pharmaceutical facilities.
4. Environmental Monitoring Analytics
Cleanrooms generate large volumes of environmental monitoring data.
Tracking trends manually can be difficult.
Power BI helps visualize:
- Particle counts
- Temperature
- Humidity
- Differential pressure
- Microbiological trends
Example
An Environmental Monitoring Dashboard can highlight:
- Alert-level excursions
- Action-level excursions
- Area-wise contamination trends
- Historical comparisons
This improves risk management and inspection readiness.
5. Batch Performance Analytics
Every pharmaceutical batch generates valuable process data.
Using Power BI for Pharma, manufacturers can analyze:
- Cycle times
- Yield losses
- Process deviations
- Production bottlenecks
- Resource utilization
Example
A tablet manufacturing plant can identify:
- Which equipment causes the most delays
- Which products have the highest rejection rates
- Which shifts achieve the best productivity
This enables continuous process improvement.
Power BI Use Cases Across Pharma Departments
Production
- OEE Dashboards
- Shift Performance Monitoring
- Production Planning
- Yield Analysis
Quality Assurance
- Deviation Tracking
- CAPA Monitoring
- Audit Readiness Dashboard
- Compliance Scorecards
Engineering
- Maintenance Analytics
- Equipment Reliability
- Energy Consumption Analysis
Supply Chain
- Inventory Dashboards
- Vendor Performance
- Procurement Analytics
Regulatory Affairs
- Submission Tracking
- Compliance Metrics
- Inspection Readiness
Leadership Team
- Executive KPI Dashboards
- Site Performance Reports
- Business Intelligence Reports
Key Benefits of Pharma Dashboards
Organizations implementing pharma dashboards typically experience:
Improved Decision-Making
Managers gain instant access to critical information.
Faster Reporting
Reports that previously took days can be generated automatically.
Enhanced Compliance
Visibility into deviations and quality events improves regulatory readiness.
Increased Productivity
Teams spend less time collecting data and more time solving problems.
Better Resource Utilization
Analytics help optimize workforce and equipment usage.
Reduced Operational Costs
Data-driven improvements lead to measurable savings.
Industry 4.0 and the Future of Pharma Analytics
The pharmaceutical industry is rapidly moving toward Industry 4.0.
Key technologies include:
- Artificial Intelligence
- Machine Learning
- Digital Twins
- IoT Sensors
- Cloud Computing
- Advanced Analytics
Power BI acts as the visualization layer that connects these technologies.
Future pharmaceutical facilities will increasingly rely on:
- Predictive analytics
- Automated decision support
- Real-time monitoring
- Smart manufacturing systems
Professionals who understand analytics will have a significant career advantage.
Skills Pharma Professionals Need in 2026
The demand for data-driven pharma professionals is growing rapidly.
High-demand skills include:
Technical Skills
- Power BI
- Tableau
- SQL
- Excel Analytics
- AI & Machine Learning
- Data Visualization
Pharma Skills
- CGMP
- Validation
- Regulatory Compliance
- Project Management
- Digital Transformation
Leadership Skills
- Strategic Thinking
- Problem Solving
- Change Management
Professionals who combine pharma expertise with analytics capabilities are becoming increasingly valuable.
As highlighted by Gaurav Dakshini’s Skillup to Scaleup mission, the future belongs to professionals who continuously upgrade their skills in data analytics, project management, AI, and Industry 4.0 technologies. The Pharma Architect Master Class includes dedicated training on Power BI, Tableau, Digital Transformation, AI/ML, Project Management, and Pharma Industry 4.0 concepts designed specifically for pharma professionals.
How to Start Learning Power BI for Pharma
If you’re new to analytics, follow this roadmap:
Step 1: Learn Power BI Fundamentals
Understand:
- Data Import
- Data Cleaning
- Data Modeling
- DAX Basics
Step 2: Build Pharma Dashboards
Create dashboards for:
- Deviations
- Production KPIs
- Maintenance Metrics
- Audit Tracking
Step 3: Learn Data Storytelling
Insights matter more than charts.
Focus on communicating business value.
Step 4: Apply to Real Pharma Problems
Use actual manufacturing scenarios to gain practical experience.
Step 5: Master Advanced Analytics
Move into:
- Predictive Analytics
- Machine Learning
- Industry 4.0 Applications
Common Mistakes When Implementing Power BI
Avoid these mistakes:
Too Many KPIs
Focus on critical metrics.
Poor Data Quality
Analytics are only as good as the data.
No Business Context
Dashboards must answer business questions.
Lack of User Training
Adoption is critical for success.
Static Reporting Mindset
Interactive dashboards should drive action, not just reporting.
Frequently Asked Questions
What is Power BI for Pharma?
Power BI for Pharma refers to using Microsoft Power BI to analyze pharmaceutical manufacturing, quality, compliance, engineering, and business data through interactive dashboards and reports.
Why are pharma dashboards important?
Pharma dashboards provide real-time visibility into manufacturing operations, quality metrics, compliance performance, and business KPIs, enabling faster and better decisions.
Can Power BI improve GMP compliance?
Yes. Power BI helps organizations track deviations, CAPAs, audits, environmental monitoring, and quality metrics, improving compliance oversight.
Is Power BI useful for pharmaceutical manufacturing?
Absolutely. Power BI enables production monitoring, predictive maintenance, batch analytics, quality management, and operational excellence initiatives.
What skills should pharma professionals learn for Industry 4.0?
Power BI, Tableau, AI/ML, Project Management, Data Analytics, Digital Transformation, and Regulatory Compliance are among the most valuable skills.
Conclusion
The pharmaceutical industry is entering a new era where data is becoming one of the most valuable assets. Organizations that effectively leverage Power BI for Pharma and advanced pharma data analytics capabilities are gaining significant advantages in productivity, compliance, quality, and operational excellence.
Modern pharma dashboards provide the visibility required to make faster decisions, reduce inefficiencies, improve compliance readiness, and drive continuous improvement across manufacturing operations.
For pharma professionals, learning analytics is no longer optional. It is becoming a core competency for career growth and leadership success in the Industry 4.0 environment.
If you’re ready to master Power BI, Data Analytics, AI/ML, Digital Transformation, Project Management, and other future-ready pharma skills, explore The Pharma Architect Master Class by Gaurav Dakshini. Designed specifically for pharmaceutical and biopharmaceutical professionals, the program helps you develop practical, industry-relevant skills that can accelerate your career and prepare you for the future of pharma manufacturing. The program includes dedicated modules on Power BI, Tableau, AI/ML, Industry 4.0, Project Management, and Regulatory Excellence.
Enroll Today: https://gauravdakshini.com/courses/the-pharma-architect-master-class/
Your trusted partner for pharma skills, systems, and solutions.

