No products in the cart.
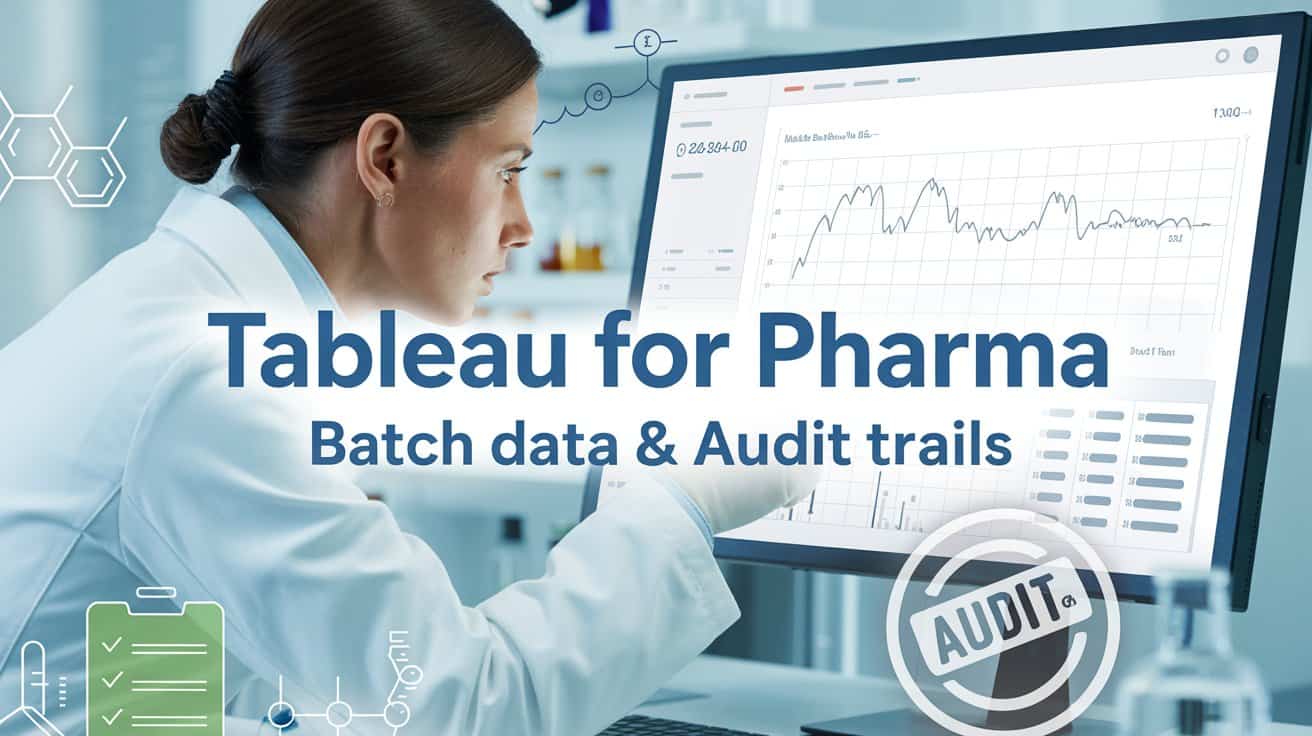
Tableau for Pharma: How to Visualize Batch Data and Audit Trails Effectively

Introduction: Why Pharma Needs Powerful Data Visualization Tools
In the fast-paced, highly regulated world of pharmaceuticals, timely and accurate data is crucial. But raw data isn’t enough. Pharma professionals need clear, actionable insights to make informed decisions in real time. That’s where Tableau for pharma comes into play.
Whether you’re managing batch data from manufacturing or tracking audit trails for regulatory compliance, Tableau enables you to turn complex data into visual stories. In this blog, we’ll explore how you can harness Tableau to improve transparency, efficiency, and regulatory readiness in pharmaceutical operations.
Table of Contents
- What Is Tableau and Why Use It in Pharma?
- Benefits of Using Tableau for Batch Data Visualization
- Using Tableau to Track and Visualize Audit Trails
- Best Practices for Implementing Tableau in Pharma
- Examples of Pharma Dashboards with Tableau
- Data Integrity and Compliance Considerations
- Common Challenges and Solutions
- FAQs
- Final Thoughts & Action Plan
1. What Is Tableau and Why Use It in Pharma?
Tableau is a powerful business intelligence and data visualization platform used to create interactive dashboards, graphs, and reports. It connects seamlessly with databases, spreadsheets, and cloud platforms, making it ideal for regulated industries like pharmaceuticals.
Why pharma loves Tableau (Tableau for Pharma):
- User-friendly interface (drag-and-drop dashboarding)
- Real-time data monitoring
- Advanced filtering for batch-level analysis
- Seamless integration with LIMS, MES, ERP systems
- Support for GxP data environments
2. Benefits of Using Tableau for Batch Data Visualization
Batch data can be overwhelming due to volume and complexity. Tableau for pharma helps make sense of this data by turning it into visual narratives.
Key Benefits:
- Track trends and anomalies in batch production
- Monitor real-time production KPIs
- Improve batch release cycle times
- Enable better decision-making through pattern analysis
Examples:
- Batch yield trends over time
- Time-to-release comparison across sites
- Deviation frequency by product or location
Visualization Types:
- Line charts for trend analysis
- Heat maps for batch deviation concentration
- Box plots for process variation
3. Using Tableau to Track and Visualize Audit Trails
Audit trails are critical for regulatory compliance (FDA 21 CFR Part 11, EU Annex 11). Tableau allows you to visualize audit logs in a meaningful way.
Tableau can help:
- Highlight unusual access patterns
- Track who changed what and when
- Create exception dashboards for non-compliant actions
- Aggregate audit data across systems for oversight
Dashboards can include:
- Top 10 most accessed records
- Most active users by department
- Frequency of data edits by user role
4. Best Practices for Implementing Tableau in Pharma
🔒 1. Ensure Data Integrity:
- Connect Tableau only to validated sources
- Use row-level security for sensitive data
- Audit Tableau server configurations
🧩 2. Integrate with Pharma Systems:
- Connect Tableau with LIMS, MES, SAP, or Oracle systems
- Use scheduled extracts to sync batch data
- Build standardized templates for SOP dashboards
🧠 3. Train Cross-Functional Teams:
- Empower QA, QC, Manufacturing, and RA teams to build and read dashboards
- Host internal workshops on “GxP Dashboarding with Tableau”
5. Examples of Pharma Dashboards with Tableau
| Dashboard Type | Purpose |
|---|---|
| Batch Yield Tracker | Monitors yield across shifts, batches, and equipment |
| Deviation Heatmap | Pinpoints areas with frequent quality issues |
| Audit Trail Analyzer | Logs user activity and tracks non-compliant changes |
| Stability Testing Overview | Visualizes results over shelf life |
| Equipment Utilization Dashboard | Tracks downtime and cycle efficiency |
Screenshot Suggestion (Alt Text):
“Interactive Tableau dashboard showing batch-wise yield trends with filters for site and date range.”
6. Data Integrity and Compliance Considerations
When using Tableau for pharma, compliance with GxP, FDA 21 CFR Part 11, and Annex 11 is essential.
Key Compliance Practices:
- Lock Tableau dashboards used in regulatory reporting
- Maintain audit trails for dashboard changes
- Validate Tableau as a reporting tool (IQ/OQ/PQ)
- Document SOPs for Tableau usage and dashboard updates
💡 Tip: Use Tableau extensions only after risk assessment and validation.
7. Common Challenges and Solutions
| Challenge | Solution |
|---|---|
| Complex pharma data formats | Use data prep tools like Tableau Prep or Alteryx |
| Resistance to new tools | Start with pilot dashboards for high-impact use cases |
| Compliance concerns | Involve QA/RA during tool configuration |
| Skill gap | Provide tailored Tableau training for pharma use cases |
8. FAQs
Q1. Is Tableau FDA-compliant?
Tableau itself is not FDA-compliant out-of-the-box, but when configured correctly and integrated with validated systems, it can support compliance with 21 CFR Part 11.
Q2. Can Tableau be used for real-time batch monitoring?
Yes. When connected to live data sources (e.g., MES or SCADA), Tableau can offer real-time or near-real-time insights.
Q3. What pharma departments benefit most from Tableau?
QA, QC, Manufacturing, Regulatory Affairs, R&D, and even Pharmacovigilance teams can benefit from interactive dashboards.
9. Final Thoughts: Empower Pharma Data with Tableau
Tableau for pharma is more than just a visualization tool—it’s a bridge between raw data and informed decisions. From batch data insights to audit trail tracking, it empowers teams to be proactive, compliant, and data-driven.
✅ Action Steps:
- Identify your top 2–3 high-value use cases
- Start with a pilot dashboard for batch data or audit logs
- Train your teams on visual best practices
- Integrate Tableau securely with validated systems
Whether you’re managing clinical operations or manufacturing floor output, Tableau can transform how you see and act on pharma data.
Read More:
Power BI vs Tableau in 2025: Which Data Visualization Tool Is Right for Your Business?


